Fractal Branch Distribution Experiment Corresponds with Universe Galaxy Distribution.
The following continues my work on fractal cosmology. To access my papers and developments, look back to my recent posts over the last year.
I experimented on a tree to see if the fractal corresponds with galaxy distribution from the latest galaxy survey.
Introduction
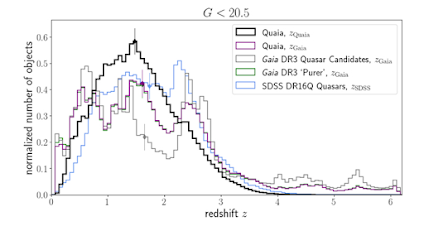
The recent Gaia telescope Quaia survey of the universe produced a galaxy distribution diagram (Figure 1) that shows an uneven distribution of galaxies with distance. 3D map of over 1 million black holes traces where the universe's dark matter lies.
Figure 1. Galaxy distribution diagram (Figure 11) from the paper: Quaia, the Gaia-unWISE Quasar Catalog: An All-sky Spectroscopic Quasar Sample, Hogg and others https://iopscience.iop.org/article/10.3847/1538-4357/ad1328This diagram offers an opportunity to test whether this universe distribution shape corresponds with the distribution from a fractal tree. If so, the observation location may be inferred. The rise from the origin, 0 distance, to a maximum is of interest. This suggests the observer's location in the fractal structure or at the edge of it and that the distribution is not constant.
The fractal already demonstrates Hubble expansion and accelerated expansion. Corresponding distribution shape would offer weight to the question of whether or not the universe is a fractal.
It was hypothesised the distribution would resemble the Figure 11 plot with a skewed bell shape with a long tail and that the location of Earth observation is on the edge of the fractal, in ‘the branches’ of the fractal universe.
Method.
To test for the distribution, the distance from the top left branch of the tree (the observation point) to the centre of every branch on the fractal tree was measured. A frequency distribution diagram was produced.
For this proof-of-concept investigation, an image of an oak tree that resembles a real Oak tree was selected. The tree was leafless.
Inkscape software was used to measure the distances of the following tree from https://www.vectorstock.com/
An SVG vector diagram tree was selected to test the proof of concept and see if there is a relationship. Studying a real tree is a very timely exercise.
Results.
The following is a histogram of the results, with the distance from the observer against the frequency.
Discussions and Conclusions
The histogram produces a basic bell shape, though it is not skewed. The frequency does rise from the point of observation and does decline at the farthest distance. This rising from 0 is constant with the hypothesis the observer is at the edge of the fractal. The lack of a skew and a tail may be due to the fractal tree chosen. Different trees have different trunk-to-branch relationships, and this was not tested for. Also, what was measured was a single point for each branch (including the trunk) on the tree. If branches were assigned a concentration of points, say 10 each, no matter its size, the histogram may have differed and produced the hypothesised. Again, this was only a proof of concept.
There is an opportunity to conduct a more rigorous experiment with differing fractal shapes.
From this simple experiment, the galaxy distribution diagram (Figure 1) is of a fractal with the observation point at its head or centre. The skew results from the branches of the fractal and the long tail, the trunk.
This demonstration, along with Hubble and the accelerated expansion of the fractal, may lead to the inference that the universe is a fractal.


Comments
Post a Comment