Posts

Showing posts from 2011

A theory of everything: to blog, or to publish?

  I have since published in 2023:  Update: I have published on this blog, read here. I have been having a difficult time recently and am unsure what to do.  What do you suggest? I have taken down my many entries on the fractal because I am afraid they will not stand as an official claim to knowledge. Do I publish here on my own, using the low-cost web technology, or go through the usual costly, slow peer review process? My discoveries with the fractal have led me to - what I believe - a straightforward theory of Quantum Mechanics, or what might be called ' a theory of everything'. When I listen to the 'experts' on quantum mechanics, it is as if they are speaking about the same things I have discovered—but not yet published—in the fractal—everything!: duality, uncertainty, entanglement, time, and relativity. What am I to do? A 'highly' academic colleague has advised me to write articles, publish them, and shut down my blog. On the other hand, yesterda

Adaptation and the fractal

Image
This entry adds to my entry on the evolution of the fractal. It should go without saying - but it does require a mention. Adaptation is demonstrated by (or in) the fractal as a change in shape; it is a change in the 'different' component of what makes a fractal—' same' but 'different' across all scales. If we substitute or add time, this may be read as 'same' but 'different' across  all time scales. This is to say that the same rule or shape will repeat in different ways—through time—as a result of outside influences; it will adapt or change. This adaptation is best demonstrated in the fossil record—'same' but 'different' through time.   It may be useful to reflect on the elasticity of the shape, its elasticity or sensitivity to change, changes through scale and/or time. This is shown in the diagram below and described in an earlier entry on Decay.

fractal: A theory of mind, shape, objects knowing

Image
Is our mind a fractal object or pattern collector, and if so, does the fractal explain laughter and sadness - as the object changes, its shape changes? This entry follows up on my earlier blogs on equilibrium, particularly the shape being set at or around iteration 7. Fractal development: Koch snowflake and equilibrium at iteration 7 Could this be how our minds recognise  –  and know  –  objects or shapes? If the universe is full of repeating patterns, then to know something, all we need is a collection of patterns; we don't need any detail at all. This can be demonstrated (below) by Koch snowflake development: as the snowflake develops, the 'stickman' develops; at some point  –  around 7 plus or minus 2 iterations  – the shape is known, and the stickman is defined. At iteration one, we know nothing. In the above diagram, we see the fractal development of a human figure. At iteration 1, the shape is unknown; by iteration 5, we know it is a recognisable human

The Paradox of Value, fractal

Image
The paradox of value or the diamond water paradox is well established, and it is not my intent to challenge it but rather show that the fractal complements it—explains it. As I have shown earlier, the demand curve is derived from the fractal. It follows that if there is any substance of truth to my thinking, it must address the likes of this paradox, too. The answer to this paradox of value is that diamonds are valued highly because they are assumed to be scarce. They have a low Total Utility and a high Marginal Utility (or value). Goods similar to this are positioned to the left of any Marginal analysis diagram. Water is less valued than diamonds because  it is (assumed) abundant. Water has a high total utility and low marginal utility. The fractal explains this paradox - or at least demonstrates it.   If the object is not developed fractally speaking, it is positioned to the elastic left end of the fractal MA curve in Fig. 1: another iteration will return a similarly hig

The fractal record

Image
The fractal record – like the fossil record that inspired its name – is a record of the ‘different’ (occurrences) of the ‘same’ (object or rule), not only through time - as in the fossil record - but through the present, the now. It is a record of the where? The examples - at all scales. This is to say that the fossil record is actually a fractal record - that traces the path of bones through time. The fractal record is based on laws of fractality (which I will release soon) and, most importantly, on the principle of ceteris paribus - setting all else constant. In this state, the only thing discernible, or true, is the object, as demonstrated below in the Koch snowflake development and the creator-scape. Of course, the fractal record is the foundation of language, knowledge, and science; it is universality. And I have great plans for it. Used correctly, we shall see that the discovery of the fractal was one of our great discoveries.

Pareto Efficiency, fractal

Image
Fractal Pareto Efficiency In a comment made on my fractalnomics YouTube clip, Pareto and the fractal came up—is there a connection? Not to take the creativity from the person with the question, I began to think about it myself.   Pareto efficiency is where one cannot be made better off without making another worse off.  It is said to be achieved at your full potential or market equilibrium. Fractal Pareto Efficiency Since the fractal demonstrates and shows market equilibrium (see my earlier work), fractal equilibrium is also the point of Pareto efficiency. Further to this - and trying to be in line with the Pareto efficiency definition (above) -  the merging of  fractal development with fractal decay (as seen below) shows fractal Pareto Efficiency, where: ('new') information cannot be gained by losing ('old')information. or, put another way - we cannot go forward or grow without leaving something behind.

Universal ceteris paribus: fractal

Image
Ceteris Paribus - keeping all other factors equal or constant. Fractal Isolation This entry shows that fractals demonstrate that Ceteris Paribus exists in reality and has connections directly to our understanding of reality—even possibly at the atomic scale.   Ceteris Paribus  is a central assumption behind economic models and analysis—and, of course, unbeknown to others, all science itself. It assumes or sets all other factors equal or constant, allowing us to study the pattern of the object in question. Without it, the 'cause' and the 'effect' would not be discernible—or would be confused in the 'chaos'. I often explain to those outside economics that this is our way of achieving a controlled laboratory experiment. This is also seen as the weakness of economics, as we don't (really) live in a 'ceteris paribus' world; we live in chaos. I would strongly argue—again—that this is the weakness of all the 'sciences'. We may have theories,

1.2a Negative Marginal Utility is misattributed

Image
This entry is an addition to my earlier work on fractal marginal utility, something I have been reluctant to add due to the consequences of such a statement. I am convinced that negative marginal utility is misattributed: the MU curve does not go negative, as shown below. Wikipedia. The fractal shows us that production and benefit are never separated; you cannot have one without the other. The increasing marginal cost (MC) after fractal equilibrium (green in Fig. 2 and 2b below) is more than enough to account for this 'negative marginal utility'. The cost rises - greater than the satisfaction or benefit  -after fractal equilibrium: this is the feeling of being ill after excess consumption, of having had too much of something.

paradigm: fractal

Image
I put it out there, paradigms are a fractal phenomenon. This insight is only a day old (2011-09-02): It was inspired by talking to one of my students. Last year, I saw that she (not knowing it) drew or doodled Sierpinski fractals (below) in the corner of her workbooks, and I thought it was pretty cool. I pointed out to her  - at the time - that she could only draw down to 7 plus or minus 2 different triangle sizes in one doodle. Yesterday, she returned to me and questioned me again on this: Is that the limit? 7?   I explained that 7 plus or minus 2 at one standing, view, or perspective, but if we zoom in, we will see more and more - as they come into focus, but there will always be 7 - yes. Later, it came to me that this standing or perspective is a paradigm, as demonstrated by the fractal development below. The paradigm is the view from the first iteration to fractal equilibrium. A change in paradigm comes with zooming into the fractal (universe), leaving the past behin

Fractal (Information) Decay

Image
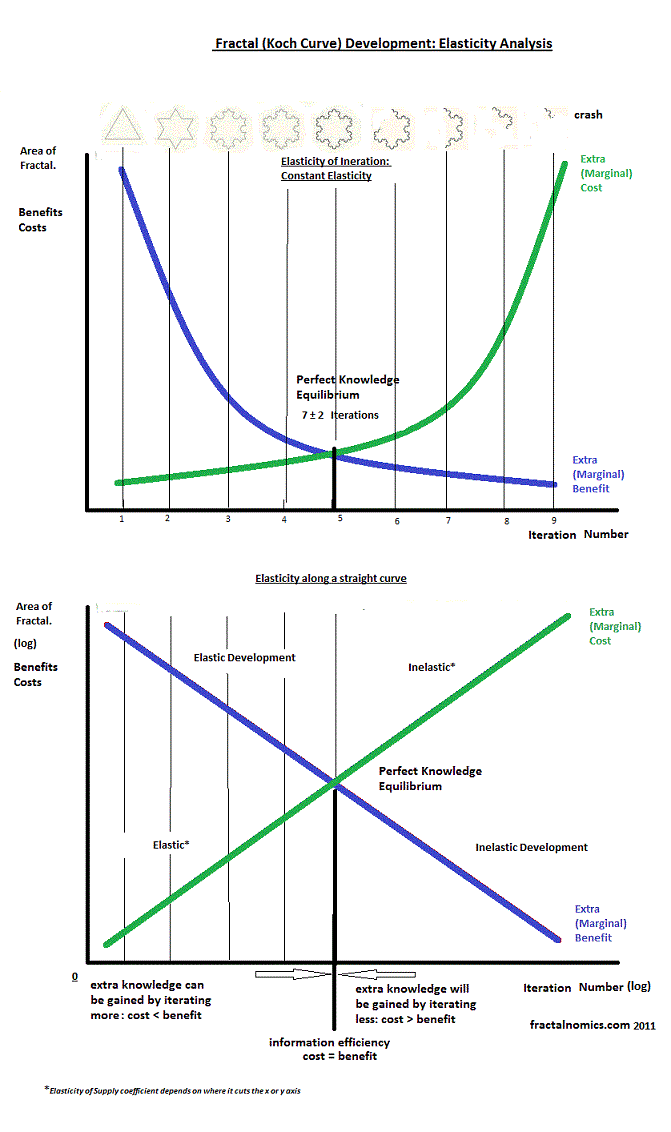
Fractal Decay As shown in the animation below and described in my earlier entries, the fractal demonstrates development and growth, but if this is reversed, it also demonstrates decay. It develops from the first simple iteration to the complex and, in reverse, decays from the complex to the simple, from the snowflake to the triangle. fractal growth and development Analysis Below are two diagrams that analyse the Koch Snowflake fractal: the top diagram shows the exponential, and the lower the log. Both are split vertically (with a 'black' line of reflection), showing development on the left side and decay on the right side. Keep your eye on the snowflake.  The blue curve  shows the extra benefit of another iteration (in terms of Area), and  green - the extra cost of producing or iterating.  As fractal development is exponential, it follows that so is decay. The above diagram of the two shows the exponential curve - with a constant elasticity (or sensitiv

The credit card effect

The credit card effect (as opposed to 'the butterfly effect') - one person's (credit card) debt could bankrupt a country - or even the world's economy. This is the perfect economic fractal example of dangerous massive debt burdens migrating from the small scale (individual) to the large scale (country);  the principle or idea (of debt) is the same, and the scale is irrelevant. I explained the world's economic problems to my 10-year-old daughter by reducing the problem to her scale—it was very easy. Today, through the mechanism of (moral hazard) bank bailouts, countries are being  burdened. Where to next? This is the perfect storm. '

Object: transformation, formation, creation

Image
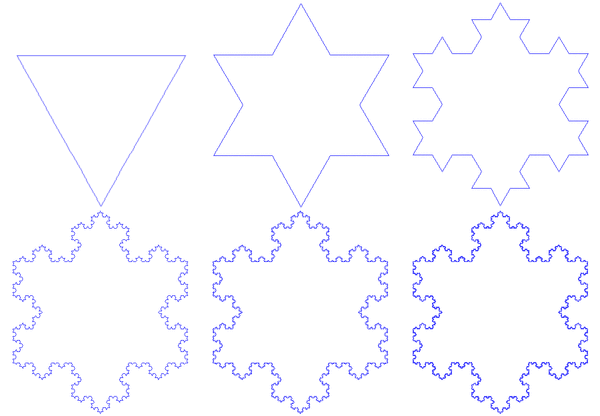
From a triangle to the formation of a snowflake, this is a (universal) demonstration of creation: transformation, the creation of an object. Many to make one. Emergence Q. Is the original triangle the big bang? Animation of Koch Snowflake development

Fractal Elasticity along the straight line curve.

Image
Fractal Elasticity - along the straight line curve. Click to see the most recent developments that complement this entry. After discovering in my early blog that the elasticity of the Koch Snowflake fractal  is constant, I have since pondered what the meaning of all this is. Economic theory suggests that all objects have constant elasticity or are logarithmic in nature. The next step is to straighten out the fractal curves. I produced the following diagrams to do just that and to demonstrate the change in fractal elasticity as the fractal developments. The above diagram shows constant elasticity and the below variable elasticity along the straight (log) curve.

(Christmas) tree Lorenz Curve

Image
After completing my  Lorenz analysis of the Koch Snowflake fractal , I set about analysing a real-life fractal and chose a Christmas tree. This has been a side interest from my core fractal work and thinking, so I have not written it up as a 'science report'. I don't know which species of tree I selected, but it is a typical conifer of the northern hemisphere. Method I trimmed all the branches off the tree, counted them, weighed them, recorded results, then ranked the branches from lightest to heaviest, completed a cumulative percentage rank of weight and count table, and finally graphed the results. Branches everywhere: Below is the Christmas tree Lorenz Curve in terms of weight. Note that 'cumulative percentage of triangle weight' should read branch rather than a triangle. I found that there were 5 levels of branches. I will be honest with you. I did not continue counting and weighing the branches in detail after the third level—the time cost was just

1 + 1 does not equal 2

It came to me yesterday - in an epiphany: 1 + 1 does not equal 2: if it does, it is only half the answer; the other half lies in understanding chaos and fractals. The definition of (or insight from) the fractal is the same but different (or regular irregularity) - at all scales. Fractals show us how no two objects are the same; they are complex and  different . The 'same ' component of the definition is quantitative and met or described as the 1 + 1. The different is qualitative and describes (at least) the diversity, complexity or unpredictability of the object. Update 2015 I have long thought about my early entry and now know more. If 2 identical objects are added together, they equal 1. They are indistinguishable. I have also learned this is an assumption at the quantum level where particles are assumed to be identical, which supports my fractal quantum theory. I plan to write all this in one paper as soon as possible. Blair

Rationality and Chaos

Updated: 29th Nov. 2012 This is an entry I have wanted to do for some time. It is the first of three fractal insights I have discovered into economic assumptions (rationality, ceteris paribus, and perfect knowledge). This is a very difficult subject to describe; I hope I give it justice. Understanding rationality is closely related to—if not the same as—understanding 'chaos': that is, complex systems are unpredictable. If we are to understand rationality, then we should understand chaos and, thus, fractals. The definition of the fractal (attractor) is: same but different , at all scales. In our Economic models, we use the assumption ceteris paribus: we hold all other variables constant and treat all persons as rational to see the order (or the 'same', as in the definition) amongst complexity - just as other sciences do.  This definition may be adapted or interpreted in this context of rationality to read as rational but irrational at all scales. This is to say that

Fractal Monopoly vs Perfect Competition or Knowledge

Image
Fractal analysis demonstrates  Information asymmetry :  Monopoly and Perfect Competition The diagram below shows the development of the fractal Koch Snowflake. Shape equilibrium (Perfect Knowledge) - but not absolute information as the fractal is infinite in detail or size - is reached at iteration 4 -  where the marginal benefit equals marginal cost.  Perfect Knowledge or ‘perfect information'  is achieved only with free, open, competitive, or unobstructed feedback. Any obstruction to 'iteration' in achieving this equilibrium—due to what may be termed a knowledge monopoly—will produce an incomplete fractal shape, imperfect knowledge, and asymmetric information. At some stage in the future, when things calm down, I plan to come back to this entry and update and further explain it: there is just so much to do.

Evolution and the fractal

Image
Evolution and the fractal Many references from leading biologists and mathematicians suggest that evolution has (often) found fractal ways or has used fractal ways.  This is totally misleading. Evolution is a feature of the fractal. Evolution is always, and everywhere, fractal.   Dictionary Search Results ev·o·lu·tion noun  /ËŒevəˈlo͞oSHÉ™n/  evolutions, plural The process by which different kinds of living organisms are thought to have developed and diversified from earlier forms during the history of the earth The gradual development of something, esp. from a simple to a more complex form - the forms of written languages undergo constant  evolution Synonyms noun:  development ,  growth ,  progress If evolution is defined as change through time and  fractality: as the ' same' but 'different' - at all scales Then, evolution is a (universal) fractal process, and it can be demonstrated in the fractal - i t is a law

Butterfly Effect a flawed argument; Credit Card Effect better

I think the 'Butterfly effect' has a flaw or is at least misleading. It suggests two attractors: the (flying) butterfly, which is governed by aerodynamics, and the (blowing and turbulent) typhoon, which is governed by thermodynamics.  Chaos theory suggests that each and every attractor demonstrates 'chaos' in a system and that a system (an attractor) in isolation will experience chaos - without any other influences. The real butterfly effect may be more like: ' The flapping of a butterfly's wings could explain the presence, or existence, of the large (747) jet aircraft flying today—which is aerodynamics; or the heat emitted from the butterfly's breath  could explain the typhoon, which is thermodynamics. What do you think? The credit card effect - one person's credit card debt could bankrupt a country - or the world. Dangerous debt burdens migrate from the small scale—individual—to the large scale—country—through moral hazard bail

Uniformitarianism and the Fractal

Image
Uniformitarianism : The key to the past can be found in the present. I have a strong interest in geography and geology, and it was here that I first read of Hutton’s uniformity. After teaching development economics, I soon found that this principle may be more universal and may show up in economics, too. The law of uniformitarianism reveals itself in the fractal. To describe a fractal, one would eventually cover the principle, only instead of reading as above—the key to the past can be found in the present—it would read as the key to the present (scale) can be found in the small scale—or conversely, the large scale, assuming a ceteris paribus approach (holding all else constant or frozen). In the tree fractal below, the new (present) cross-section line b-b will share the same (but different) as the old (past) cross-section line a-a. Scale is the only difference in time (age) and size. Fractal Demonstration of Uniformity It is another insight into the fundamental characteristi

Macro and Micro and the Fractal

Image
Updated 29th Nov 2012 There are many insights - in relation to macro/micro - that can be taken from the fractal. Firstly, and importantly, when viewing a fractal (in isolation) scale cannot be discerned, the object maybe any size at all, from infinity small to infinitly large; the object shares the fractal charactoristic of being 'same' but 'different' at every scale. The object's shape can be discerned, and from this, an attempt can be made to deduce an understanding of the process to produce it. The object is the 'same'; the examples are infinitely 'different'. Examples: income, wealth, trade, selection, reproduction, specialisation and so on. We see the same but different - at all scales. These principles repeat throughout the universe and are central to biology, chemistry, and physics. This observation sheds light on whether there is a distinction between micro and macro: the fractal shows us that there may be no real separation between th

Fractal Long Run Short Run

Image
The fractal demonstrates the economic short-run and the long-run In line with the classical economic view of the short run and the long run - best demonstrated by images of  cost curves - the fractal is the math of the said phenomena. Short Run: The development and growth of the fractal from iteration 1 to the equilibrium iteration is the fractal (economic) Short Run. The Short Run is the effect of the starting rule, e.g., branching or adding triangles. The Long Run: The Long Run is the end state, the total superposition, where all the infinite possibilities are shown: the state where the equilibrium iteration shape is set—to the fully developed tree or snowflake.

Fractal equilibrium count

Image
Continuing on from my earlier blog on fractal equilibrium : Koch Curve Animation From a fixed viewpoint: all fractals ('attractors')  form their shape (are at fractal equilibrium) at and around 7 plus or minus 2  iterations - any more than this will come at too high a cost, and with no extra benefit - as shown in the animation of the Koch Snowflake development above. The 5 iterations to develop the fractal Koch snowflake in Fig. 1 (below)—the point where the blue extra (Marginal) area (MA) and green extra (Marginal) cost (MC) intersect—correspond to the point  where the shape of the snowflake is fully developed.  I believe this is not only a demonstration but also an explanation for The Magical Number—Seven, Plus or Minus Two—and is also observable throughout our reality. From any standpoint, there will be around 4,5,6,7, or 8 levels of protrusion. For example, from where I am writing, I can see out my window a park and some buildings. The building is the first pro