Posts

Showing posts from July, 2011

The credit card effect

The credit card effect (as opposed to 'the butterfly effect') - one persons (credit card) debt could bankrupt a country - or even the world's economy. This is the perfect economic fractal example where dangerous massive debt burdens have migrated from the small scale (individual) to the large scale (country);  the principle or idea (of debt) is the same, the scale is irrelevant. I explained the world's economic problems to my 10 year old daughter by reducing the problem to her scale - it was very easy. Today - through the mechanism of (moral hazard) bank bail-outs - it is countries that are getting burdened. Where to next? This is the perfect storm. '
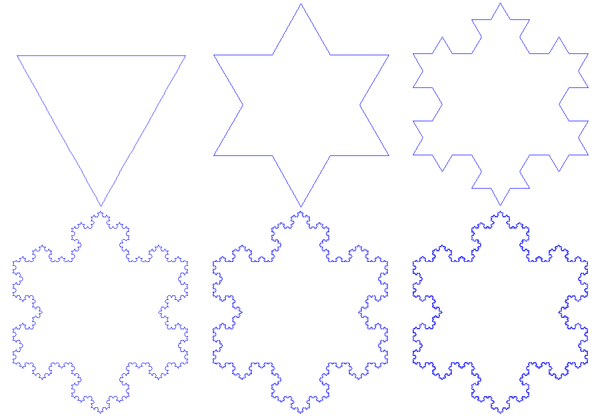
Object: transformation, formation, creation

Image
From a triangle, to the formation of a snowflake, this is a (universal) demonstration of creation: this is transformation, the creation of an object. Many to make one. Emergence Q. Is the original triangle the big bang? Animation of Koch Snowflake development

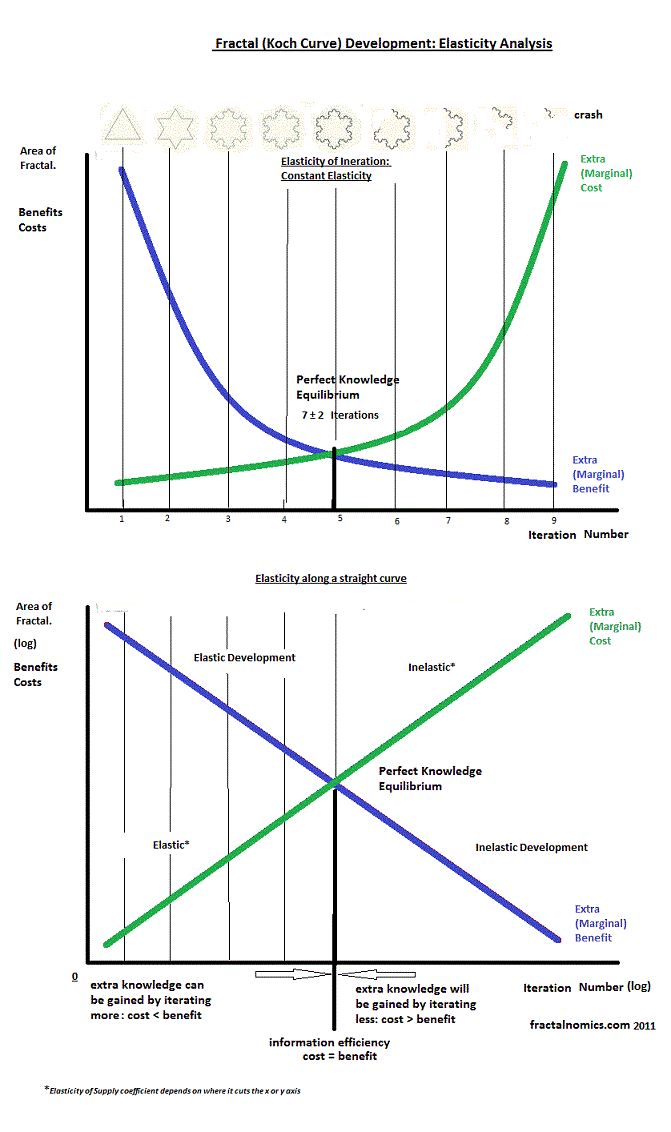
Fractal Elasticity along the straight line curve.

Image
Fractal Elasticity - along the straight line curve. Click to see most recent developements that complement this entry. After discovering in my early blog that the elasticity of the Koch Snowflake fractal  is constant, I have since pondered on what is the meaning of all this? Economic theory suggests that all objects have this constant elasticity or are logarithmic in nature. The next thing to to is to straighten out the fractal curves. I produced the following diagrams to do just that and to demonstrate the change in fractal elasticity as the fractal developments. The above diagram shows constant elasticity, and the below variable elasticity along the straight (log) curve.

(Christmas) tree Lorenz Curve

Image
After completing my  Lorenz analysis of the Koch Snowflake fractal  I set upon analysing a real life fractal and chose a Christmas tree. This has been a side interest from my core fractal work and thinking so I have not written it up as a 'science report'. I am not sure of the species of tree I selected, but it is typical conifer of Northern hemisphere. Method I trimmed all the branches off the tree, counted them, weighed them, recorded results, then ranked the branches from lightest to heaviest; completed a cumulative percentage rank of weight and count table, and finally graphed the results. Branches everywhere: Below is the Christmas tree Lorenz Curve in terms of weight. Note that 'cumulative percentage of triangle weight' should read branch rather than triangle. I found that there were 5 levels of branches. I will be honest with you, I did not continue counting and weighing the branches in detail after the 3 level - the time cost was just so high and it